Wednesday, 10 February 2010

Italian Foreign Minsiter: Iranian militia tried to attack embassy

Italian Foreign Minsiter: Iranian militia tried to attack embassy

Pro-government militias tried to attack the Italian Embassy in Tehran today, the Italian foreign minister says.
Given the US experience in 1979/1981, this is not to be taken lightly. Iran has been increasingly bellicose toward the west in recent days.

Or maybe theyre trying to get the Buoni´s they bought refunded...

Update

YMH0 - still  sideways  below 9995 and 38.2 fib, indicators  are +ve  but  not  really  saying much.

Xau/Usd - Broken previous res. @ 1074 and held  for the moment at  ma´s  144/130 ema´s and more importantly 200 lwma.  Break back through 1074 spells  more sideway chop. A break thru the ma´s and 50 n 61.8 fibs  will  be tgted.

Xag/Usd - 15.35 caps.. above tgts 15.47 hrly 100ema  and 38.2 fib.A break through 15.15 sends us  back  lower.

USDX - Currently holding at daily S2 and  minor retracement channel bottom. 200 sma  comes  in  lower  near the 61.8 fib.

Eur/Usd -  not really anything to write home about just here.

Gbp/Usd - cable  doin  what  cable  does....nothing  until  it  goes bezerk outa  nowhere.Eur/Gbp main influence again today.

Aud/Usd - got out of that quickly and neatly, 0.8780 will be the point to watch for another go at adding to shorts.

Usd/Chf - 1.0640 will be key near term support level.

Usd/Cad - 1.0660 daily up trend channel and 50 fib has held although hourly indicators remain bearish.. wait fr this one.

Yen crosses - same as Yen Cross Update.

Now we have a retracement...

Well finally we are starting to see more of a retracement in line with what the 4 hourly charts foretold. Sometimes its easy to get caught up in the smaller tf´s  and you lose sight of the real picture...I guess I certainly did in taking that third quarter off...Daily trend is still well and truely down.. that one I havnt forgotten...

Ok back to what matters, lets look at it like this in USD terms
Daily  -  UP
4 Hourly - Down
Hourly - Down but nearing a turn.

We are still sitting on considerable unbooked profit from our original entries and the idea is to add to those positions when we hit daily trend. Ideally that would coincide with both hourly and 4 hourly charts turning in the direction of the main daily trend.

Whilst we sit and wait for that to occur, we can watch the hourly charts for quick trades in either direction. Those that have a FIFO platform, you will need to manually record your trades and match them off as your platform will close your original entry with an entry in the opposite direction.

Ok  lets have  a  look at  these  things.

Tuesday, 9 February 2010

Yen Crosses

Aud/Jpy -  approaching hrly 200 lwma with downtrend resistance above at 78.92

Eur/Jpy -  has 50 fibo above at 123.82, with both the 61.8 and hrly 300 lwma coming in at 124.54, trend res at 125.15.

Gbp/Jpy ....ufff... having a hard enough time  with kiwi  let  alone  this  beast...  currently  at  previous channel  support turned resistance. Above here we have the more important 38.2 fib which coincides with the 100/90 ema bands.

Aussie and Kiwi

Im not happy with current price action in Aussie, in line with my rules of trading the MA, price has closed back above the 30 min ma with the  slow stoch turning back up...closing the trade @ market.

Kiwi -same as aussie

MA - Moving Average Trading

A quick note on moving average trading. My basic rules are entries on a break and close above or below the moving average we are watching, with indicators turning in the direction of the break.
The stop is generally placed above the previous swing high or low of current price action, or if price breaks back and closes through the moving average with one or more of the indicators reversing path.
Entries can be made in a combination of ways. Either enter your full trade size on the next candle open through the ma. Secondly, entering 1/4 of your total trade size on the next openning candle through the ma, then place the  balance of the entry at the ma to catch a pullback.
These are not hard and fastened rules but are merely a guide as to how I trade.

Always remember, price action is king. Indicators are merely a  safety blanket for a  favourable trade.

hmm i may have this wrong

30 min Usd/Cad and Nzd/Usd have put in doji reversal candles and the  Aussie hourly put in a hammer, as has the Eur/Usd......  30 minute indicators have crossed bearish... Stops are reasonably tight   so  not  much  damage  can be  done.. still Ill watch them and may just  close  them  early if I deem necessary.

this feels like a scene from Karate Kid

Wax on, Wax off... Risk on,  Risk off......

Sell 1 Nzd/Usd @ 0.6900 s/l 0.6940 , Aud/Usd Sell 1/4 @ 0.8705 s/l 0.8740

Aussie and Kiwi

With 8 minutes to go till the candle close I will work to sell 1/4 Aussie @ 0.8717 witha stop on this 1/4 at 0.8740. Kiwi , Nzd/Usd is also another candidate for a short a little above  here with your stop 0.6940 just above  the previous highs, 38.2 fib and 30min 200 ema.

retrace targets being met

Eur/Usd has met my initial retrace target at the 1.3640/50 zone, cable managed to get to the 23.6 fib although Eur/Gbp has quashed any further rise in that puppy, Aud/Usd just getting the wobbles  above the 30 min 100 smoothed moving average. On the Yen Crosses, Eur/Jpy has achieved the 3802 fib sitting just underneath the previous channel support turned res. at 123.14, slightly higher than my 123.05 tgt, Aud/Jpy has also met th projected retrace tgt at 78.15 currently sitting just shy of the 50% fib and the hrly 200 lwma.the Usd/Cad sits between the 38.2 and 50 fib with strong up channel support sitting  just below at 1.0658.

Gold, Silver and crude have also retraced mildly but have seen more of a consolidation / sideways trade rather than any meaningful retrace.

Keep your eye on the YMH0, break and close under the 100 sma 30min will have us back looking at the 9900 again.

OK if at first u dont suceed. ...

Cancel those last oredrs. Watching 30 Min Aud/Usd to add short now. Will sell 1/4 on a cross and close under the ma´s.


I will update the others in  the  next wee while..  havnt  even had a  coffee yet..

Well, we kinda had a retracement...

Unfortunately, we didn´t make it much past the 23.6 fib. Still,  4 hrly charts have turned againt the immediate trend. I will again be watching the hourlies for a turn in line with the 4 hrly charts to see if this time we can do better  than  the dead cat bounce we witnessed today.

Usd/Cad working to sell 1/4 @1.0740,
Aud/Usd working to buy 1/4 @ 0.8640
Xag/Usd working to buy 1/4 @ 14.95
Aud/Jpy working to buy 1/4 @ 77.15

Eur/Usd working to buy 1/4 at1.3650
Gbp/Usd working to buy 1/4 at 1.5580

no change Eur/Chf


Going out for a while

Cable a lil stronger and back above res turned support at 1.5625...only concern is another late day rally in the stocks ... but not really fussed at this point.

Eur/Usd

Previous support turned resistance holding Euro for the moment.

Cable breaks res as Eur/Gbp sinks

Eur/Gbp currently siting on interim support..
Aud n Eur at pennant tops

It is days like this ...

It is days like this when, if you stare at the sceens for too long, you will go blind....or stir crazy.. In regard to our positions nothing has essentially changed on the fundamental side. Technically, 4 houly charts are calling for a retracement, whilst the shorter time frames have now swung back in our favour.

Stocks seem to be running the show today, so its best to keep an eye on them, set your alerts n alarms a todays ranges n go do those errands you should have done last week.

YMH0 - Back at 9900 level again

Although still very quiet in Forex Land,  stocks seem to have someone very interested to hold the line at 9900 in the dow  and 1055 in  the mini s+p. Crude also has an admirer at 71.00

Market seems quite happy to do nothing... so far

Markets seem quite happy to do nothing thus far today, with the price action in most pairings backing itself into forever narrowing pennants in the defined ranges set by Asia and European trade....

As far as the order books  go they look like this -
 Order central: Monday
  • Russian bids in EUR/USD at 1.3620/30; Offers 1.3715/20
  • Stop-loss sell orders in Cable at 1.5480
  • Exporter offers at 89.90/90 in USD/JPY, bids at 88.80/90
  • Japanese importer bids in EUR/JPY  at121.50
Also of interest is crude oil where there does seem to be someone interested in keeping crude above the 71.00 handle.

Comex Pits come in selling on the open

Monday, 8 February 2010

Nyk selling Usd first up

The Jim Cramer of weather

http://www.youtube.com/watch?v=kpxiCxO5k0g&feature=player_embedded#

Pretty much back where we started

Its been a choppy ol monday with prices pretty much back where we  started the day in Asia. I am mindful of the fact that the 4 hrly charts have turned against the current bullish Usd trend, with fridays closes clearly warning of a retracement, but, as i said in my inicial update the shorter tf´s just dont look right to me here...Nyk boys should be coming in soon to add life to this party.

On the fundamental side , the data cupboard is bare today with nothing of any relevance coming out of G7 over the weekend. There will be mounting speculation on the thursday meeting of Eurozone heads coming up with a possible solution to the Greek crisis. 

I missed the topping formation in Eur/Gbp, but have set an alarm  should we see a spike back above 0.8785.

Cancel Cable order

Buy 1/4 @ 1.5550 oco 1.5630

Might just be able to squeeze a lil more outa this one...again patience is the key.

Commodities getting the wobbles

Oil, Gold and Silver are starting to get the wobbles. USDX - Dollar Index  back above the open. Keep an eye on that Usd/Cad at 1.0720.

60 min Eur/Gbp reversal

The Major Japanese Candlestick Patterns


A Doji is formed when the open and the close are the same or very close. The length of the shadows are not important. The Japanese interpretation is that the bulls and the bears are conflicting. The appearance of a Doji should alert the investor of major indecision.


The Gravestone Doji is formed when the open and the close occur at the  low of the day. It is found occasionally at market bottoms, but it's forte is calling market tops. The name, Gravestone Doji, is derived by the formation of the signal looking like a gravestone.


The Long-legged Doji has one or two very long shadows. Long-legged Doji's are often signs of market tops. If the open and the close are in the center of the session's trading range, the signal is referred to as a Rickshaw Man. . The Japanese believe these signals to mean that the trend has "lost it's sense of direction."


The Bullish Engulfing Pattern is formed at the end of a downtrend. A white body is formed that opens lower and closes higher than the black candle open and close from the previous day. This complete engulfing of the previous day's body represents overwhelming buying pressure dissipating the selling pressure.


The Bearish Engulfing Pattern is directly opposite to the bullish pattern. It is created at the end of an up-trending market. The black real body completely engulfs the previous day's white body. This shows that the bears are now overwhelming the bulls.


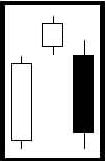
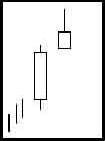
The Dark Cloud Cover  is a two-day bearish pattern found at the end of an upturn or at the top of a congested trading area. The first day of the pattern is a strong white real body. The second day's price opens higher than any of the previous day's trading range.


The Piercing Pattern is a bottom reversal. It is a two candle pattern at the end of a declining market. The first day real body is black. The second day is a long white body. The white day opens sharply lower, under the trading range of the previous day. The price comes up to where it closes above the 50% level of the black body.


Hammer and Hanging-man are candlesticks with long lower shadows and small real bodies. The bodies are at the top of the trading session. This pattern at the bottom of the down-trend is called a Hammer. It is hammering out a base. The Japanese word is takuri, meaning "trying to gauge the depth".


The Morning Star is a bottom reversal signal. Like the morning star, the planet Mercury, it foretells the sunrise, or the rising prices. The pattern consists of a three day signal.


The Evening Star is the exact opposite of the morning star. The evening star, the planet Venus, occurs just before the darkness sets in. The evening star is found at the end of the uptrend.


A Shooting Star sends a warning that the top is near. It got its name by looking like a shooting star.
The Shooting Star Formation, at the bottom of a trend, is a bullish signal. It is known as an inverted hammer. It is important to wait for the bullish verification. Now that we have seen some of the basic signals, let's take a look at the added power of some of the other formations.

Open Trades

Open Trades

Eur/Usd - short 1.4000 stop @ 1.4000 .
Closed 1/4 @ 1.3850.
Closed 1/4 @ 1.3750.

Gbp/Usd - short 1.6015 stop 1.6015.
Closed 1/4 @ 1.5845.
Closed 1/4 @ 1.5755.
Working to buy 1/4 @ 1.5550 oco 1.5630 on stop

Aud/Usd - short 0.8898 stop  0.8898.
Closed 1/4 @ 0.8805.
Closed 1/4 @ 0.8688.

Usd/Cad - long 1.0555 stop 1.0555.
Closed 1/4 @ 1.0635.
Closed 1/4 @ 1.0720.

Aud/Jpy - short 80.35 stop 80.35.
Closed 1/4 @ 79.91.
Closed 1/4 @ 76.61

Xag/Usd   Spot Silver - short 16.81 stop 16.75.
Closed 1/4 @ 16.25.
Closed 1/4 @ 15.65.

Eur/Chf - long 1.4575 stop 1.4620
Closed 1/4 @ 1.4703
Working 1/4 tp @ 1.4750

Monday initial update

Guess thats the problem when one has a family and lives at the ass end of the world ..... Sunday night is not the best night to be sitting down glued to the screens.. Missed the chance to exit the third 1/4 of our open trades so I´d better get to work on that.. Taking profit is possibly the hardest part of trading for me, so, its a  work in progress... I always try to keep a mindset being, that if I am short and looking to take profit, I ask myself. Would I go long at this point?...If the answer is  no, then stay short...  ok. you get the drift.

coffee, check
smokes, check
eyes open n cleared, check

lets begin.


Eur/Usd - 4 hrly chart crossed bullish, immediate downtrend  broken at 1.3645 and has reached 30 min 100 sma, slightly through the 23.6 fib..shorter time frames indicators are also bullish but are looking a little weak. Wait n see if we get a pullback to exit the third 1/4.

Gbp/Usd - Hmm  cable  made lower lows...must be Eur/Gbp.. Also  cable  stopped at previous daily support  now  turned resistance..1.5624.Work to buy 1/4 at 1.5550 oco 1.5630 on stop.

Aud/Usd - Similar to Euro, 4 hrly chart crossed bullish and price has broken  immediate down trend, but again shorter tf charts look weak. Will watch to see  how price action unfolds between 0.8655/0.8720.

Usd/Cad - Missed that one completely...1.0720 has been an important level over the last few days and price held there during the asian session..a quick look at crude, gold and silver says that  rather than trying to chase this big red bus down the street, its better to wait and see how  things develop in Nyk trading. Watchong 1.0630/40 area for support.

Yen Crosses - a quick look at the YMH0 chart tells me the retracement off fridays lows is still unfolding , although like the Euro and Aussie short term indicators look fragile and price remains under 9995 breakdown level.
Aud/Jpy - 77.32/78.15 levels to watch.
Eur/Jpy - 121.80/123.05
Gbp/Jpy -  23.6 fib has held the retracement thus far , 4 hrly chart as in the case of the cable has not crossed bullish as yet. Think we may see choppy trade between 138.50/140.00.

Xag/Usd - Spot Silver remains in a tight range after the bounce out of the lows on friday. 4 hrly charts are beginning to cross up bullish . Shorter tf´s are bullish although indicators are starting to look a little tired. 15.05/15.35 defines the immediate range.

hang on, hang on... Update coming

Down to the 30 minute charts we go

Not quite the openning I had pictured, but never mind. 30 minute charts  I will use to take profit on the third 1/4 of our trades and leave the last 1/4 to run.

I will update the post when I have either market entries or limit orders to  place.

FOREX LIVE - Openning comment

Majors slightly higher in early interbank trade

By Sean Lee  || February 7, 2010 at 19:36 GMT
|| 1 comment || Add comment
It was all risk-off on Friday afternoon so it’s not a big surprise to see some profit taking in the early interbank market. EUR/USD is trading at 1.3700 after closing in NY around 1.3665. EUR/JPY is at 122.50 and cable is at 1.5650. The G7 was the usual gab-fest with nothing of note emerging. The members were more interested in getting their passes for the winter Olympics sorted out.
Good luck today.

Sunday, 7 February 2010

Mini Dow Futures - YMH0

Big daily hangman on yesterdays close. Also 4hrly hangman. Looking for a retrace toward 10050/10080 res area.

Yen Crosses


Eur/Jpy - 4 hrly hangman closing candle at the lows of the week possible reversal signal. Through hourly res line at 122.50, retracement targets 38.2 fib and measured move at 123.05.

 
Aud/Jpy - Not as clear as Eur/Jpy but also a 4 hrly hangman close off the lows. 


 Gbp/Jpy - Doji or hangman bottom 4 hrly close, possibly heading back to 141.00 channel res.


Definitely a retrace coming - USDX

The Dollar Index - USDX has met the AB CD measured move target at 80.82 after yesterdays break and close abive the 200 day simple moving average. The doji candle formed at yesterdays close with a gap-up open from thursday combined with slow stochastic crossing over bearish at oversold levels is the clearest warning we could get that an imminent retrace is on the cards . A reversal monday closing back below the 200 day sma would confirm this scenario with a retracement target of 78.81 also the 50% fib.

Saturday, 6 February 2010

Cable

Daily chart - remains bearish and continues in the mild bearish weekly down channel. Support at 1.5515 .

4 hrly chart - A minor AB CD measured move targeting 1.5580 was met friday after price broke the daily support line at 1.5640. Indicators are bearish, but slow stochastic is warning of a retracement. A much stronger warning however, is the formation of the closing 4 hrly hammer candle off the weeks lows.


the last two times we saw a similar candle was 30th december at 1.5870 and the 1st of feb at 1.5920. Both resulted in retracements of 50 to 61.8%.

Looking at the overall bearish structure should the retracement copy that of the previous monday then the retracement should look to target 1.5775 area , slightly above the 38.2 fib.

Hourly Chart - Charts have moved into bullish mode with trend resistance at 1.5675 also 23.6 fib.

How to Play this - A retracement is imminent should the res. at 1.5675 give way. I will look to exit the third 1/4 of our 1.6015 short on any  innitial pullback from the trend res around the 1.5600 lvl. The remaining 1/4 I will allow to run until the trend turns bullish on the daily charts.

Taking Stock

Now that the markets have closed for the week its a good time to take stock of things and chart gaze.

Eur/Usd -
Daily trend is firmly lower with the 61.8 fib at 1.3485, Daily Trix still bearish, price bounced off down channel support at 1.3585 to form a hammer looking candle which would point to a retrace coming. Droping to to 4 hourly chart, slow stochastic has crossed up with Trix beginning to turn up although has not crossed +ve.
Looking at previous patterns we have two scenarios which may be unfolding.
1. Price copys the minor bounces seen on 21st of January and the 1st of ferruary which would give us a move to 1.3740/50, then a continued move lower to the 61.8 fibo on the  daily chart.
2. Should price break the 1.3750 lvl then a longer retracement may be unfolding very similar to that of  the retracement of the 22nd of december to the 13th of january. looking at a possible AB CD measured move to 1.3940 which also coincides with the daily down channel resistance.
The price action late friday has turned the indicators bullish, thus turning us to immediate resistance of which 1.3720 looks the most probable, with 1.3745 the 38.2 fib and fridays high.

How to play this -
Given that daily charts remain bearish and 4 hrly charts have not turned up, the chances of a pullback into the 1.3650 area remain good. A break of 1.3750 would indicate that the case for a longer and stronger retracement. Should the 1.3750 area hold, I would expect to see a pullback into 1.3645 where I will be watching to exit the third 1/4 of our open 1.4000 short. If 1.3750 area breaks then I will exit the third 1/4 @ market.

The remaining 1/4 will run until I see a break of the 4 hourly 100 lwma, which would indicate a return to the down channel resistance currently perched at 1.4225

Sorry, A little pre occupied at present -

 Buscando a Widget....

We have lost our precious Widget, more like someone grabbed her...7 month old toy poodle with legs shorter than your average caramelo koala... she´s the genius behind this operation so you had better pray we get her back or I´ll  be looking  for  another job...


Sorry we missed the absolute lows, but , a  late friday afternoon retrace with absolutely zero liquidity hasn´t exactly changed  things, has it ?  Down trends are still intact against the buck in all  pairs, with indicators still negative and only if they break with indicators positive will I  look to cut another 1/4, leaving the remaining 1/4 to run until I see a trend reversal occuring on the daily charts.

ECB's Trichet says ECB won't hold a meeting on Sunday

Bugger Greece, Spain and Portugal´s economic woes.....   Im off for a weekend of dog sledding, Canadian beer and  all  the free seal products I can get my  hands  on.....

Crude Oil - CLH0

R2 holds on first touch, next level 68.60 then R3 at 66.45....  Any bets on another tape by Osama over the weekend

Crude Oil - CLH0

Breaking support  and weekly up channel. , support  now  at daily R1 then R2 at 69.44

On closer inspection

Patience is the key to trading, with 4 hourly indicators firmly in the negative and hourly indicators begining to turn back lower I think the best option is to sit and wait for both 4 hrly and hourly indicators to begin to turn back up.

Probably a good time to walk away from the screens for a bit  and  see what the real world is doing.

Watch the hourly candle closes

I will be watching this hourly close carefully. Lows have been breached in quite a few pairs, but no follow through, which would suggest that we have probably seen the lows for today and the week.... With G7 and a myriad of rumours floating about relating to emergency meetings by Eurozone and ECB officials, traders will be keen to lock in profits and minimise exposure over the weekend.

Should we indeed get doji bottoms in a few of the pairs I will close another 1/4 @ market and call it a week.

Its almost a case of who isn´t in trouble in Europe...

Ukraine faces serious cash flow pressure, S&P says

Through the lows, and down she goes....

Where they´ll  end, nobody knows...

14.83 next silver

Rumours of an emergency ECB meeting over the weekend

Might just be Trichet´s excuse to avoid going to the artic north of Canada this afternoon...

Trade Update

I will be watching the levels carefully to either cover the third 1/4 of our open trades should the market attempt a reversal.   

Open Trades

Eur/Usd - short 1.4000 stop @ 1.4000 .
Closed 1/4 @ 1.3850.
Closed 1/4 @ 1.3750.


Gbp/Usd - short 1.6015 stop 1.6015.
Closed 1/4 @ 1.5845.
Closed 1/4 @ 1.5755.


Aud/Usd - short 0.8898 stop  0.8898.
Closed 1/4 @ 0.8805.
Closed 1/4 @ 0.8688.


Usd/Cad - long 1.0555 stop 1.0555.
Closed 1/4 1.0635.
Closed 1/4 @ 1.0720.


Aud/Jpy - short 80.35 stop 80.35.
Closed 1/4 @ 79.91.
Closed 1/4 @ 76.61


Xag/Usd   Spot Silver - short 16.81 stop 16.75.
Closed 1/4 @ 16.25.
Closed 1/4 @ 15.65.

Eur/Chf - long 1.4575 stop 1.4620
Closed 1/4 @ 1.4703
Working 1/4 tp @ 1.4750

SEC's Schapiro says in 'coming weeks' agency will consider proposals to restrict short selling

Now  if I´m not mistaken the last time they did that  stocks got smashed....

Ok, Dust has settled and cooler heads have regained control

Eur/Usd - 1.3645/1.3745

Gbp/Usd - 1.5655/1.5745

Aud/Usd - 0.8610/0.8720

Usd/Jpy - 89.10/90.00

Usd/Chf - 1.0695/ 1.0740

Aud/Jpy - 76.87/78.30

Eur/Jpy - 121.95/123.40

Gbp/Jpy -  139.62/141.50

Usd/Cad - 1.0645/ 1.0695

Crude watchin 72.20/45 support area

Covered 1/4 Eur/Chf @ 1.4703 , working another 1/4 @ 1.4750 stop 1.4620

Hmm what to do...

With a real mixed bag of data out of the Labour Department I´m left scratching my head as to what to do...I think its reasonable to say that we all know these numbers are a  joke and real unemployment in the US  if  far closer to 20% than 10%.. But you gotta trade what you see..

Thus far the 10´s have  fallen  sharply  from a spike to 118.77 down to the daily pivot at 118.06, currently  at 118.25, with yields rising Usd/Jpy and the other yen crosses have risen, taking with them  the lesser dollars of  Aussie, Kiwi and Canada.. Stocks are rising on may be a better unemployment number, but should these 10´s continue to sell off the impact of higher yields should quickly quash the bounce.

Bear flags are seen on all Yen pairs -


Watch the 10´s, UsdJpy n stocks will go in the opposite direction

for  the  moment  anyways...

US Change in Nonfarm Payrolls (Jan) M/M -20K vs. 15K (Prev. -85K, Rev. to -150K), Net -188K

What a mess

US Unemployment Rate (Jan) M/M 9.7% vs. Exp. 10.0% (Prev. 10.0%)

Pop, Flop or Drop

A lil under 5 minutes till the NFP, estimates are  as  wide  as +100k to -100k averaging  a  gain of +14k, as for the unemplyment rate estimate is between 9.8%  and 10.3% with 10% the most favoured.

What ever the number,  it is always  best  to  let  the  dust settle before acting. Watch the reaction of the 10 year notes ZNH0 for clues.. strong numbers n they will drop indicating higher rates , opposite for bad data..

Friday, 5 February 2010

Eur/Chf

Just reading Macro Man and I see why that Eur/Chf  n Usd/Chf were so nutty over night...

¨The magnitude of the moves in EUR/CHF, meanwhile, pale in comparison. But with a central bank as erratic as the SNB pulling the levers, trading EUR/CHF is a bit like swimming with Jaws. First they defend 1.51 for 9 months....before pulling the bid and seeing the cross trade down below 1.47. While they've hit the market a few times since, their behaviour this morning was not suitable for young viewers. In a market trading 1.47, they put a 1.4905 bid into EBS; panic predictably ensued, stops were run....and here we are trading back below 1.4700 again. Someone in Zurich must love the smell of napalm in the morning....¨

NFP DAY

A quick look at the charts and not a great deal has changed. AB CD measured moves have mostly been met in all pairs with Eur/Usd reaching the 1.3645 and the Usd/Chf through the 1.0730 level. Stocks and commodities  are still sliding as further concerns over the Eurozone economies emerge with Finland the latest country to be called out.

NFP is always a ridiculous day to trade given that the numbers are an absolute lotto, and after yesterdays chaos its going  to  be  even  harder today. Main plan of action will be to manage what we have. So far we have banked 1/2 profit on all trades and I will  look to possibly  close another 1/4 on an unfavourable NFP outcome. Technically, great damage has been done, so for  the  moment I will stay with the trend and allow  the  last 1/4 to run.

Overnight  just to add  to  yesterdays fun we had our ol mates  at  the  SNB  finally  show  up  after being antagonised when traders  pushed the  pair  under 1.4600 triggering  stops. Although I did not mention it here yesterday, I did leave a limit order to buy at 1.4575 ( which was the level of the first intervention in March of last yesr) with a 1.4525 stop. the pair jumped to as high as 1.4870  before  falling  back toward 1.4700. I will  take 1/2 off  at 1.4750 with  the  stop  at  1.4620.

More  a  lil  later as we get closer to the  number

BANZAI....

Mini dow breaks 9995 support  whilst the  e-mini S+P heads  fr 1055, with the Dow cash closing a smidge under the 10,000 mark.... or  will they  change  the  settlement price...not  that  it  matters. Today was not  about Bulls  nor  Bears  it was all about pork  n  loads  of  it.

Cable -

Gbp/Usd - short 1.6015 stop 1.6015.
Closed 1/4 @ 1.5845.
Closed 1/4 @ 1.5755.

Move the 1/4 profit order Gbp/Usd to 1.5755

Crude

Crude continues to fall through fibo retracement levels and targets weekly up channel at 72.03/13 should previous lows at 72.45 give way. In hindsight the break of the 4 hrly 300 ema would have been a far better entry signal than the 1 hrly chart. Indicators are negative and will watch for a base to build to buy.

Cancel Eur/Chf

Walkin away fr a  bit and  it was  a  silly  trade anyways.

Trade Update

Open Trades

Eur/Usd - short 1.4000 stop 1.4000 .
Closed 1/4 @ 1.3850.
Closed 1/4 @ 1.3750.
AB CD Measured Move target is at 1.3645.

Gbp/Usd - short 1.6015 stop 1.6015.
Closed 1/4 @ 1.5845.

Working to buy 1/4 at 1.5730.
AB CD Measured Move target 1.5400... ok ok its a little far.. hey  but  its  cable  we are talking about...

Aud/Usd - short 0.8898 stop 0.8898.
Closed 1/4 @ 0.8805.
Closed 1/4 @ 0.8688.
AB CD Measured Move target is 0.8647. met. 0.8581 daily 200 sma.

Xag/Usd   Spot Silver - short 16.81 stop 16.75.
Closed 1/4 @ 16.25.
Closed 1/4 @ 15.65. Head and Shoulder target is at 14.18...yeh I thought it was a lil too far as well, but now it doesn´t look that unrealistic now does it.

Usd/Cad - long 1.0555 stop 1.0555.
Closed 1/4 1.0635.
Closed 1/4 @ 1.0720.
Channel top met at 1.0750.. 

Aud/Jpy - short 80.35 stop 80.35.
Closed 1/4 @ 79.91.
Closed 1/4 @ 76.61
76.30 next support.

Round 3 anyone ?

Its only just gone miday and the markets are looking kinda like a scene out of  2012...

We have taken 1/2 of our trades off with exception of the cable at 1.5730  which  we  missed  by 3 pips..

Aud/Usd

AB CD tgt met at 0.8647, next support is daily 200 sma.

Eur/Usd

1/4 off at 1.3750

Aud/Jpy again

Ok Ok I found another line  , lets try 76.25..  hopefully  it´ll  take  more than 30 seconds to get there  though.

Usd/Cad

1/4 off at 1.0720.. channel res  at 1.0750 next

Eur/Chf

ohh  theyre a brave bunch.... 1.4650 trades with trepidation... 1.4670 stop entry  30 stop tgt 1.4700... but  keep  an  eye on  it  this  is  a  dangerous game to play...and I probably pushing my luck a bit here..

Aud/Jpy....

Well that  didnt take long...1/4 off at 77.61...  now  what  i´running outa lines  here

Aud/Usd

Another 1/4 comes off at 0.8688. And the shizz hits the fan for round 2.

Crude

So much for not taking this trade....oh well  ..  Looking for price to target weekly up channel at 72.11 ..

As the dust settles

Or the blood begins to coagulate...if you were on the wrong side of that masacre. Lets take stock of what we have and what may happen next.

Open Trades

Eur/Usd - short 1.4000 stop 1.4000 . Closed 1/4 @ 1.3850. Working to buy 1/4 at 1.3750. AB CD Measured Move target is at 1.3645.
Gbp/Usd - short 1.6015 stop 1.6015. Closed 1/4 @ 1.5845.Working to buy 1/4 at 1.5730. AB CD Measured Move target 1.5400... ok ok its a little far.. hey  but  its  cable  we are talking about...
Aud/Usd - short 0.8898 stop 0.8898. Closed 1/4 @ 0.8805. Working to buy 1/4 at 0.8688. AB CD Measured Move target is 0.8647.
Xag/Usd   Spot Silver - short 16.81 stop 16.75. Closed 1/4 @ 16.25.Closed secong 1/4 at 15.65. Head and Shoulder target is at 14.18...yeh I thought it was a lil too far as well, but now it doesn´t look that unrealistic now does it.
Usd/Cad - long 1.0555 stop 1.0555. Closed 1/4 1.0635. Working to sell 1/4 at 1.0720.
Aud/Jpy - short 80.35 stop 80.35. Closed 1/4 @ 79.91.Will watch the stocks to see where I take another 1/4 back. Target is 77.61 channel support.

Eur/Chf - If 1.4650 trades , place a stop entry to buy @ 1.4670 , stop 1.4630 . targeting a  quick 20-30 pips  ... its a cheecky trade and possibly one you may want to skip..but its been a good day up until now.

Markets have been ripped apart like a hot chook today, why... I havnt even had time to look...What is important though is that ´we were on the right side of the move and have managed the trades well.

Todays closes will be watched carefullyby technicians in regard to the long term support and resitance lines and the 200 day simple moving averages. I dont want to nag on about it but NFP tomorrow  may change all of this.

Aud/Jpy

Stocks are in real trouble  with  the  Dow 30 looking to take out 10,000. That should give Aud/Jpy what it needs  to reach down channel support at 77.63.  I´ll keep 3/4 short for the moment and watch the stocks.

Hope you are all enjoying the Porkfest

Eur/Usd and Gbp/Usd

Looking to take back another 1/4 of both at 1.3750 eur/usd and 1.5730 gbp/usd.

Aud/Usd

taking back another 1/4 at 0.8688

Holy Crap

Definitely todays most used phrase, closely followed by shit and Oh F·"% ....

Gold

Approaching 1074 previous lows with Daily/Weekly trend line fome October 2008 at 1063 also 200 daily sma resides there.

Silver

Currently through the  daily 200 sma and looking for a test of  the  weekly/Daily uptrend line from October 2008...coming in at 15.60. I will take another 1/4 off at 15.65.

would the last one out please turn off the lights....

a picture is worth a thousand words....

It´s all falling apart again

Pork, Pork, Pork ......

Silver sitting on critical 16.00 with 15.87 under here, eur looking at 1.3800 option barriers, cable.. well  its  not  quite sure, aud heading to 0.8750/55, usd/jpy  sits on hrly 220/200 ema´s,  chf sits just below 1.0650 and yen crosses broadly lower sitting  just  above the previous lows.Usdcad has finally reached 1.0650 with possible next res at 1.0688 which is daily R2

YMH0 has broken the ma , but like  both gold and crude indicators are looking a little tired.

Wall street is just about to open, so we will see what they want  to do.

Gold and Crude

Gold has just broken the  hourly 200 lwma, Indicators are negative. 1093/1094 possible support zone. 


Crude has also broken the hourly 300 ema , indicators are negative. Next support lies at the pivotal 75.45.


Although indicators are negative they look somewhat tired, thus I will skip these trades and concentrate on managing what I already have before NFP tomorrow.

Just a thought

Eur/Chf  traders  seem  to  be tempting  fate pushing the pair towards the 1.4640/50 area where the SNB or BIS on their behalf, is expected to intervene...
Given where Usd/Chf currently sits above 1.0600, should the SNB come in, maybe this time the Eur/Usd may get a lift... Should we get near at 1.4650/40 area Eur/Chf, I´ll place a Stop entry about 20 points above looking to grab 20 or 30 points should we see an intervention bout.

Cheeky, maybe...  but  its  worked before.

Down go the stocks

Weaker than expected data out of the US has the stocks moving lower with the YMH0 at the hourly 200 lwma, Crude is sitting right on the 38.2 fib level and hourly 300 ema and Yen crosses have  moved lower following the stocks. Gold sits  just  above  the  hourly 200 lwma and the 50% fib.

Mr Trichet is currently speaking and no doubt the market will be listenning for his comments on Greece and other troubled Euro zone countries facing similar budgetary problems. 

ECB Press Conference up next

http://www.thomson-webcast.net/de/dispatching/?ecb_100204_stream_video

Thursday, 4 February 2010

Update

Crude and stocks finally broke support in Asia and have moved lower but compared to the currencies not that far. The Usdx - Dollar Index is back knocking on the door of the daily 200 simple moving average, Euro has breached the 1.3850 level seen last Monday, Cable has broken 1.5850, Aussie sits just above tuesday´s low at 0.8780, kiwi has broken the monday 0.6994 low, Swissy fell short of the 1.0640 high put in after SNB intervention and the Cad lies  just  short of our 1.0650 tgt at 1.0637.

With tomorrow´s NFP release  (US Non Farm Payrolls), I expect some profit taking / position trimming  to be seen over the next 24 hours before the release, thus I will be taking a 1/4 profit on open positions and  adjusting protective stops ahead of tomorrow.

Open Trades

Closing 1/4 of trades @ market

Eur/Usd - short 1.4000 stop 1.4000 . Closed 1/4 @ 1.3850.
Gbp/Usd - short 1.6015 stop 1.6015. Closed 1/4 @ 1.5845.
Aud/Usd - short 0.8898 stop 0.8898. Closed 1/4 @ 0.8805.
Xag/Usd   Spot Silver - short 16.81 stop 16.75. Closed 1/4 @ 16.25.
Usd/Cad - long 1.0555 stop 1.0555. Closed 1/4 1.0635.
Aud/Jpy - short 80.35 stop 80.35. Closed 1/4 @ 79.91.

Eur/Jpy - Trade Missed as I was out of the office when the 300 lwma finally gave way.

What I will be watching today -
Crude Oil - CLH0 - Hourly 300 ema
Mini Dow futures - YMH0 -  Hourly 300 ema and 200 lwma.
Gold - Xau/Usd - Hourly 200 lwma.
Eur/Gbp - 0.8709 - Hourly 300 sma.

Back

Well guess  it  was  good  to  step  away, trades  have  developed nicely. Those that have an itchy trigger finger  could take 1/4 or even 1/2 profit here as hourly indicators are  beginning  to  turn up. Those that  want  to  ride this  trend set in January shoould look at  the  4 hourly charts  that  have  again  turned  back negative.

My only concern is that  both  crude  and  stocks have  not  broken  to  the  downside... still  watch  everything  and  get  a  feel  of  what  is  moving  this  market.

Hope you  took  the  trades  and  are  doin  well.


I´ll be out for the rest of the day

Trades are moving nicely, silver went straight to the 100 lwma  n  stopped  dead  now  trades  at 16.45. Just watching the stocks now for them to fall which will give a short signal Eur/Jpy.
  4 hourly charts are all rolling over -ve so I am quite happy  to  hold these trades  until I return this afternoon.

Keep an eye on Crude and Gold

Both spot Gold and Crude having strong rebounds off 1111.00 and 76.80...Stocks are holding on just above support and Ma´s..

Yen Crosses

Aud/Jpy - limit sell 80.35 stop 80.85, no tgt as yet

Eur/Jpy - failed to close below the ma soI will wait.

Rest of the trades panning out nicely, especially silver which has been beaten worse than a red headed step child, currently at 16.55, will look  to add at the  hrly 100 ema.

Intraday Trade Update -

Eur/Aud - Closed 1.5755  +65
Eur/Usd - short 1.4000 stop 1.4025 , hourly break of 144 ema should see accelerated down move toward 1.3930
Gbp/Usd - short 1.6015 stop 1.6015, channel tgt met, trade open with indicators bearish.
Aud/Usd - short 0.8898 stop 0.8910, tgt support at 0.8855, hrly charts have turned bearish.
Xag/Usd   Spot Silver - short 16.81 stop 16.81, break of 16.70 now tgts hrly 100ema, a break there  would have us looking at fibo levels.
Usd/Cad - long 1.0555 stop 1.0555, broken through hrly 169 ema with tgt at previous channel sup now turned res at  1.0650.

Of the yen crosses Aud/Jpy looks like it may trigger first

Closed Eur/Aud 1.5820 short @ 1.5755 +65pips

Wednesday, 3 February 2010

Trade Update

Eur/Aud - short avg. 1.5820 stop 1.5800 .. watching for exit after reaching 50% fib. Hourly close above 1.5755 and I will exit
Usd/Cad - long 1.0555 stop 1.0555 . Possible target 1.0650 channel sup now turned res.
Gbp/Usd - short 1.6015 stop 1.6015 , approaching first tgt at 1.5965 channel support.
Aud/Usd - short  0.8898 stop 0.8915 .. I jumped the gun a little here...we still  are  holding  above the 30 min 200 ema so we still may see a  bounce toward channel res at 0.8925..indicators are turning lower but have not fired 100%
Xag/Usd  - short 16.81 stop 16.95 no tgt as yet.. trade taken on break and close of hrly 200 ema . Indicators are turning bearish but have not crossed, a break through 16.70 would confirm a retracement lower.
Eur/Usd - short 1.4000  stop 1.4035... 30 min indicators have crossed over bearish, usdchf making a bounce out of the 1.0495 area and usdx held the  hrly 200sma ...   why  not

other trades to watch -

Aud/Jpy - short on breakand close under the hourly 200 lwma with indicators bearish,
Eur/Jpy - short on break and close under hourly 300 lwma with indicators bearish.

Told you it looked like it might be busy.... Early day yet as I may have jumped the gun a little.. I will  try and move stops to entry as things begin to move in the desired direction.

Dollar Index - USDX


A big day for the markets may be on the cards

Looking at the charts we  could  be  in  for  a  big day with all major  pairing sitting  at  important short term moving averages.  As I write Cable has just fired a short trade on the 30 minute chart,  breaking and closing under the 300 Linear Weighted Moving Average LWMA with indicators turning lower , 1.5964 is first target.
Aussie  has  a  similar pattern using the  200ema  30 minute chart..

Moving averages to watch on the hourly charts are -
eur 220 sma, yen 220 ema, audjpy 200 lwma, eurjpy 300 lwma, gbpjpy 100/90 ema´s , usdcad 300 ema, kiwi 300 ema.

I will post  some  charts in a  short while.

Open trades -
Short Eur/Aud average 1.5820 , Stoploss 1.5800. Looking to exit this trade when indicators reverse.
Long Usd/Cad 1.0555, Stop 1.0540 , Target open

Certainly a strange old day indeed

Stocks went higher, gold, silver and oil closely followed by  silver  streaked skyward... Risk-On trades  back in vogue...Eur/Jpy, Aussie, Kiwi and Canada should go screaming higher right ? Ahh wrong..
Fx for all intent and purpose did very little on the day...True, the Dollar  did  suffer on the day  against most major pairings, but barely, compared to the  gains  in crude oil and gold.

Someone is wrong here, and  either the  currencies play catch-up or commodities  and  stocks are  just  about to receive another round of good old fashioned pork that they so rightly deserve.

The only trade we managed to eek out on the day was short Eur/Aud at an average of 1.5820, as I write indicators are still bearish so I will let this run a little more watching the 50% and 61.8% fib retracement levels as possible targets.  Stop is now at entry.
Talk about bad timing......

Tuesday, 2 February 2010

Morning Update Feb 1, 2010

Stronger than expected US data has the Risk-On crowd back at their desks... Yen is getting sold against everything, 10year notes being hit hard, gold and silver jumping higher and stocks making a marginal comeback toward resistance.

Monday, 1 February 2010

And their racing

13855/58 eur
1.0606/10 chf
15952/59 gbp
 0.8800/06 aud
 89.93/99 jpy

Risk off continues after absolutely nothing good comes out  of  Davos . Although the tape has not been officially recognised ol Osama was out purportedly bagging  the  buck....  hey  it  had  no  effect  on  crude  last  week  either....maybe ol Osama is becoming a bit of  a  T Boone Pickens as far as trading rec´s go..